
最近在搞ISTIO与VM集成的方案,官网上有一些文档,按照流程部署下去发现问题不少。下面对在遇到验证中遇到的一些问题和调试经验都整理了一下,供大家参考。
部署
接下来的实验的拓扑图如下所示: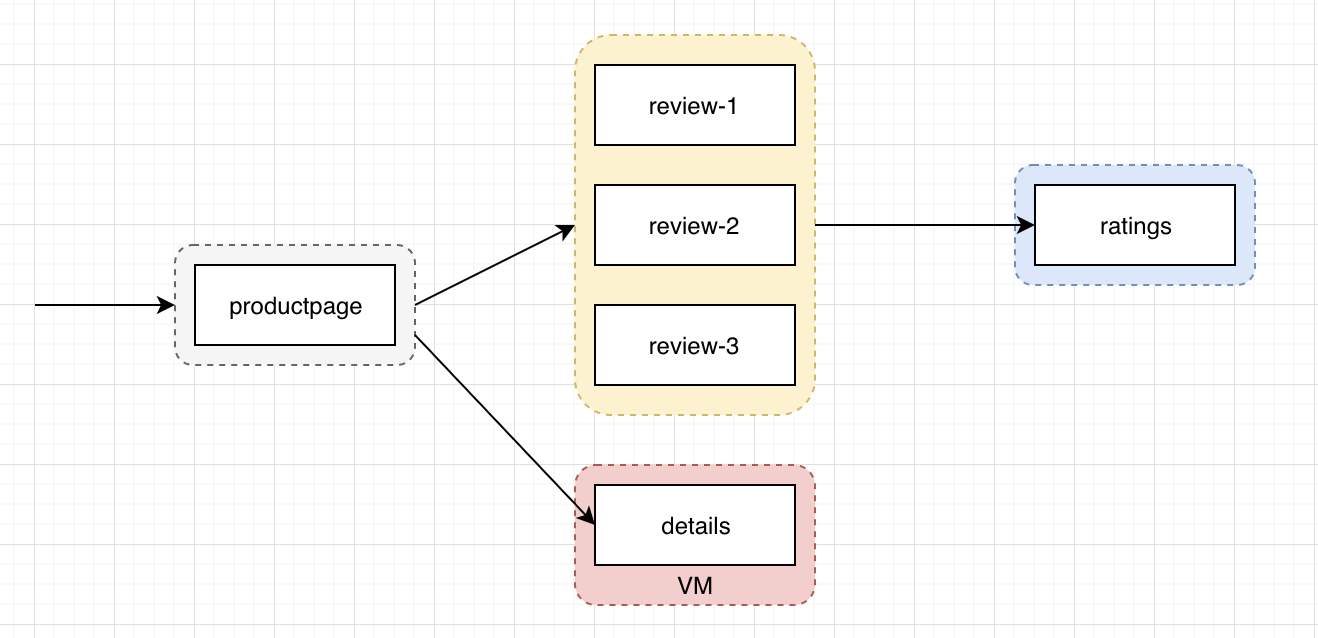
基础网络准备
为了使VM与已经部署了ISTIO的K8S集群连通,我们需要先把VM加入到k8s集群,这样会自动部署flannel网络,保障POD网络可通。这块如果使用kubeadm来部署的k8s的话,比较简单,直接kubeadm join就可以加入一个新的集群了。
为了让VM的应用可以直接使用服务名称来通信,需要修改vm的域名解析服务的配置文件 (从k8s的任意一个pod上拷贝/etc/resolv.conf)
1 | cat /etc/resolv.conf |
预安装
1 | kubectl create namespace istio-system |
安装istio
主要是需要指定 meshExpansion 扩展:
1 | helm install --set global.meshExpansion.enabled=true install/kubernetes/helm/istio --name istio --namespace istio-system --values install/kubernetes/helm/istio/values-istio-demo.yaml |
cluster.env
1 | cat << EOF > cluster.env |
准备证书
1 | kubectl -n istio-system get secret istio.default -o jsonpath='{.data.root-cert\.pem}' |base64 --decode > root-cert.pem |
安装sidecar
Debian包
针对Ubuntu,可以直接从官方下载安装包:
1 | curl -L https://storage.googleapis.com/istio-release/releases/1.1.6/deb/istio-sidecar.deb > istio-sidecar.deb |
RPM包
针对CentOS系统,需要自己编译安装包:
编译
在本地的GOPATH目录下克隆istio,然后在istio的根目录执行
1
2
3cd /go/src/github.com/istio/istio
make rpm/builder-image
make rpm/proxy安装
然后在/go/src/out/目录下可以找到对应的rpm包。
在安装rpm包的时候,会发现没有GLIBC_2.18,解决方法如下:下载:wget http://mirrors.ustc.edu.cn/gnu/libc/glibc-2.18.tar.gz
解压:tar -zxvf glibc-2.18.tar.gz进入解压文件夹,创建文件夹build, 运行configure配置:
1
2
3
4
5
6mkdir build
cd build
../configure --prefix=/usr
make -j4
sudo make install
准备用户
1 | sudo useradd istio-proxy |
启动服务
1 | sudo systemctl start istio-auth-node-agent |
sidecar.env
内容如下
1 | ## cat sidecar.env | grep -v '#' |
重启ISTIO服务
1 | systemctl restart istio |
部署业务
首先使用bookinfo中的示例来部署整个调用链中的服务和workload。
1 | kubectl apply -f istio-1.1.6/samples/bookinfo/platform/kube/bookinfo.yaml |
等k8s中所有服务都起来之后,删除details这个deployment以及其对应的services。然后在github上找到details的ruby代码文件,拷贝到VM上保存为ruby_server.rb。
在VM上需要直接使用ubuntu用户来运行该服务:
1 | ruby ./ruby_server.rb 9080 |
在k8s集群里面,重新创建details服务:
1 | istioctl -n default register details 10.244.3.0 http:9080 |
部署istio转发规则
1 | kubectl apply -f istio-1.1.6/samples/bookinfo/networking/destination-rule-all.yaml |
效果展示
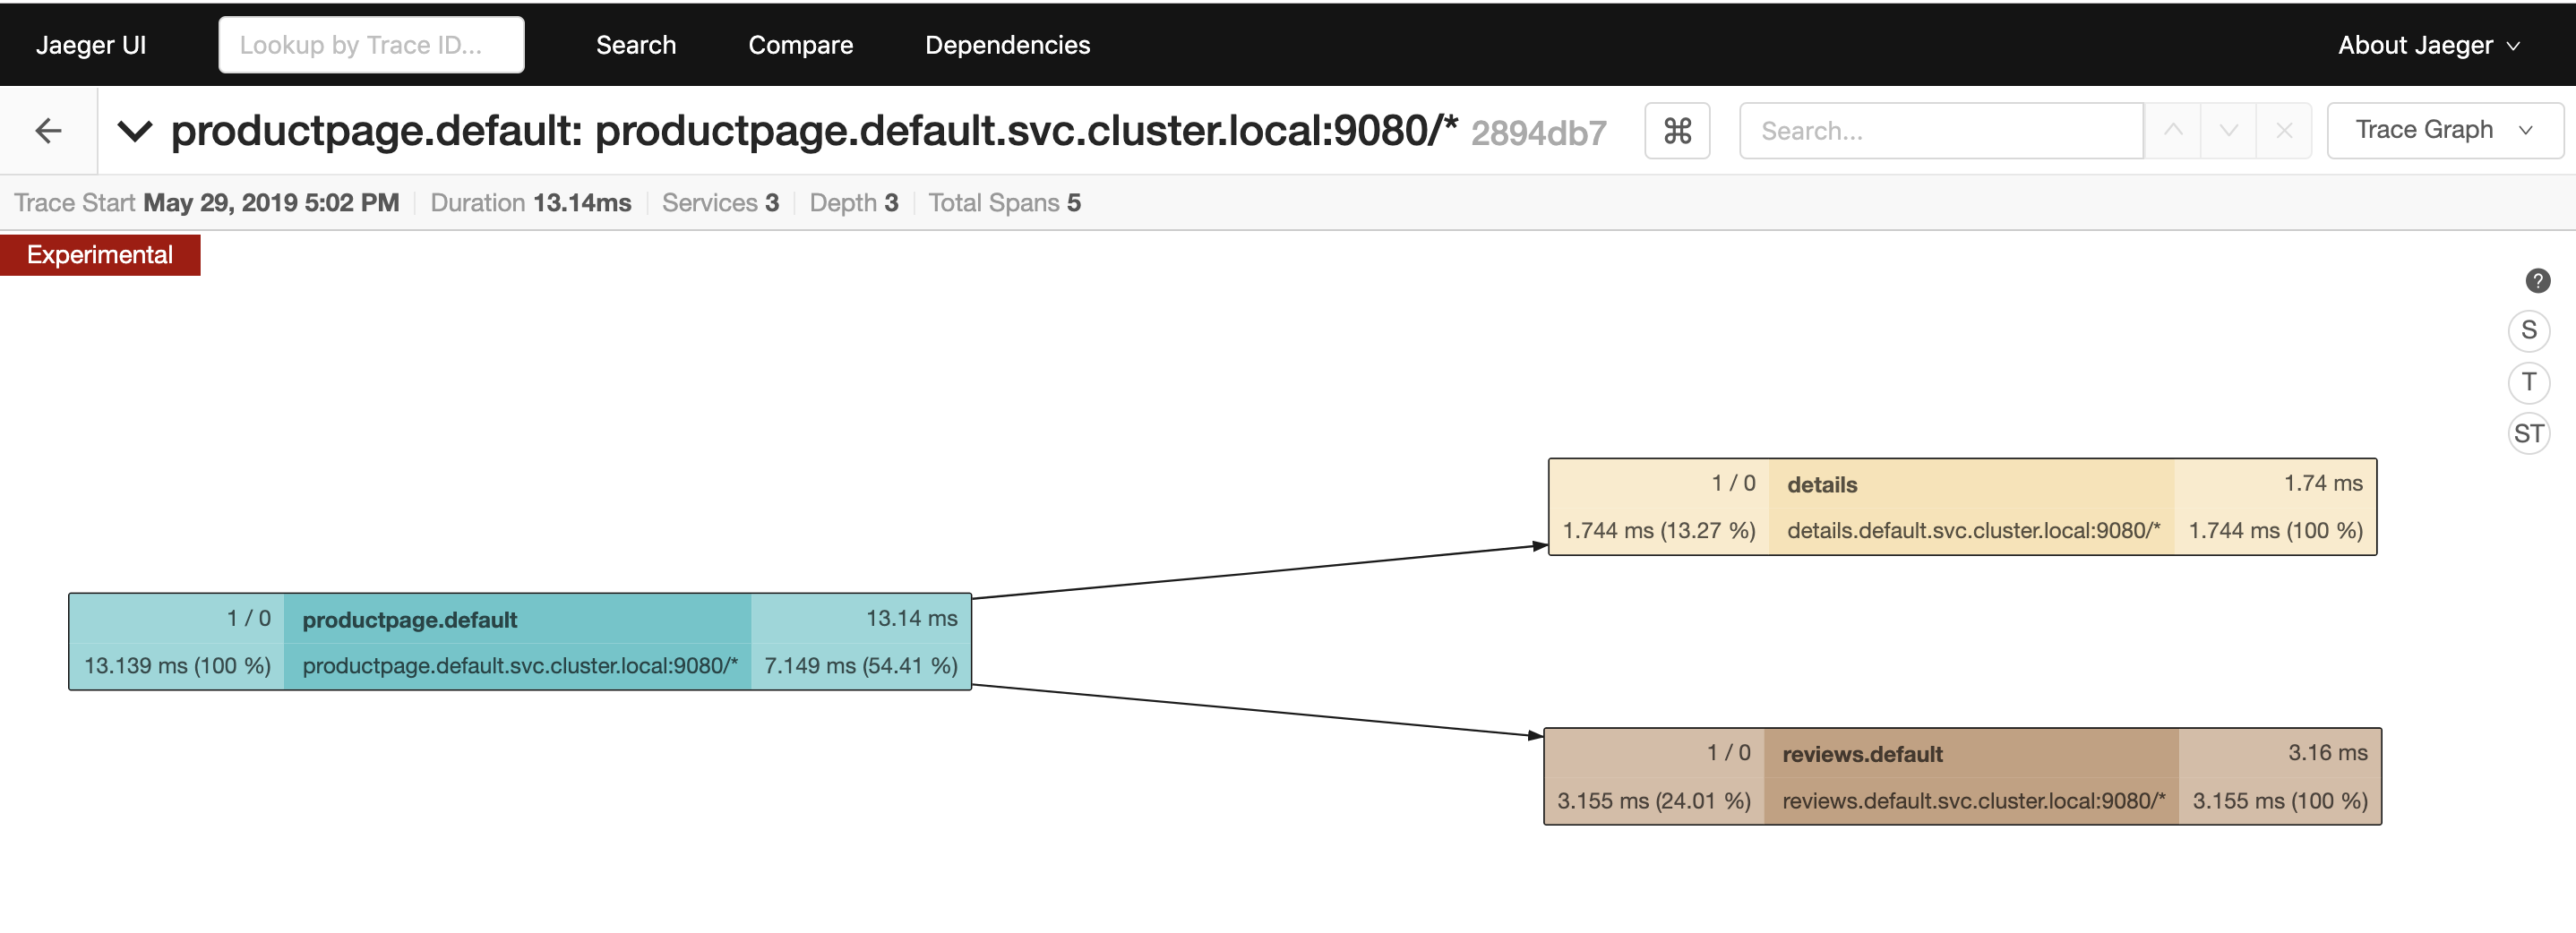
调用链

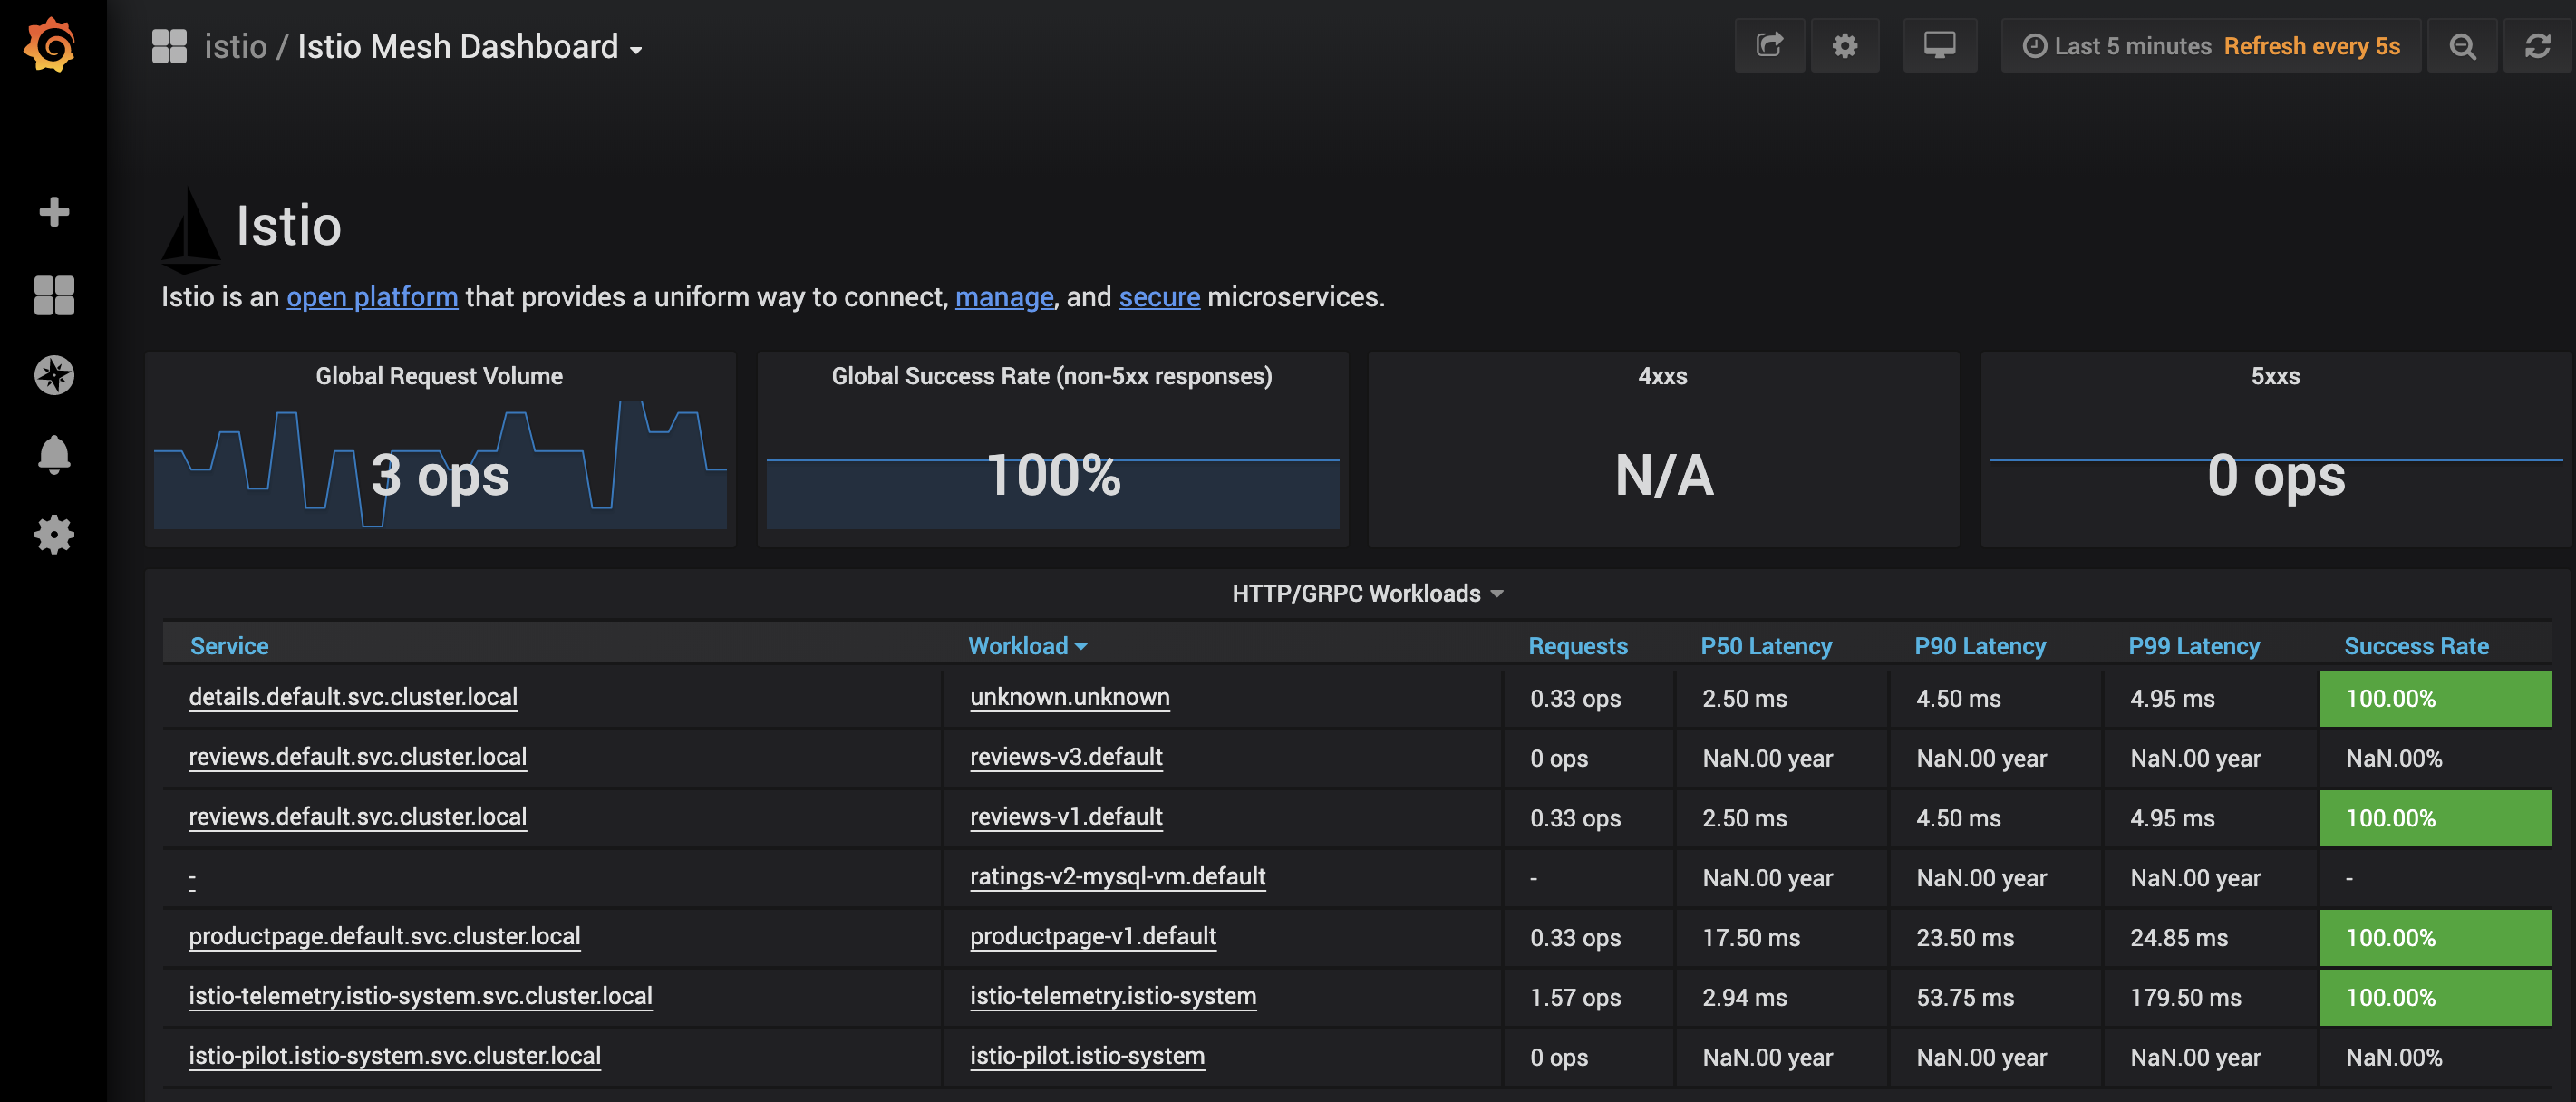
Granfana
待解决问题
VM网络转发
到当前,bookinfo的流量转发应该能够正常,但是还存在一个问题:
如果直接在vm上通过service名称来访问k8s中的其他服务,将无法经过sidecar。其主要原因是iptables,通过查看配置可以看到:
1 | # iptables -t nat -nvL OUTPUT |
由于我们在VM上部署了k8s,kube-proxy的KUBE-SERVICES链要优先于ISTIO_OUTPUT导致上面的问题。
Prometheus监控vm-envoy
由于prometheus对所有sidecar的envoy监控是通过k8s来做服务发现的,而VM的envoy并没有在k8s中体现出来。这块需要我们手动配置prometheus的target。
具体通过修改istio-system命令空间下prometheus configmap的配置, 添加vm-envoy-stats任务。
1 | global: |
kiali视图
当前还没有办法在kiali上展现出vm上流量的视图,虽然可以展示出details的service信息,但是一直报该service缺少了sidecar。我认为这应该和kialai对pod的映射有关,后续考虑看一下它的实现逻辑,应该有解决的方法。
调试经验
查看envoy的配置信息
对于pod的sidecar,直接通过nsenter进入到pid的net namespace下(对于VM直接在VM上)执行以下命令:
1 | # curl localhost:15000/help |
当然, 对于pod如果是指查看xds的配置,可以直接执行
1 | # istioctl ps |
查看envoy是否GRPC上报telemetry到mixer
需要先打开envoy的日志模块,具体如下:
1 | curl -X POST localhost:15000/logging?level=info |
可以看到如下信息:
1 | strings { |
这里就是envoy的mixer filter上报到mixer的attribute信息。每一个key都对应着mixer中内置的attribute关键字的index,每一个value对应default_workds索引。具体参考这篇文章。
之前遇到一个问题,发现envoy有通过grpc Report到mixer;同时在mixer的accessLog也能够看到logentry生成到stdio的访问日志。但是prometheus始终无法从istio-telemetry采集到istio_requests_total的指标。后来调查发现是手动通过istioctl register注册服务的时候,没有指定其协议类型导致的。
查看envoy的业务流量访问日志
istio默认是不看业务流量访问日志的,因为日志量太大。如果需要调试,需要手动修改istio-system中的configmap的配置。
1 | kubectl -n istio-system edit cm istio |
修改最后一行为/dev/stdout,这样通过查看业务pod的istio-proxy container的日志就可以看到流量的access-log了。
当然,对于VM可以直接修改这个值为一个目录,然后在VM上重启istio服务就可以在日志文件中看到流量信息。
1 | # kc logs --tail=5 -f productpage-v1-79458795bc-jdvg6 -c istio-proxy |
查看流表转发流程
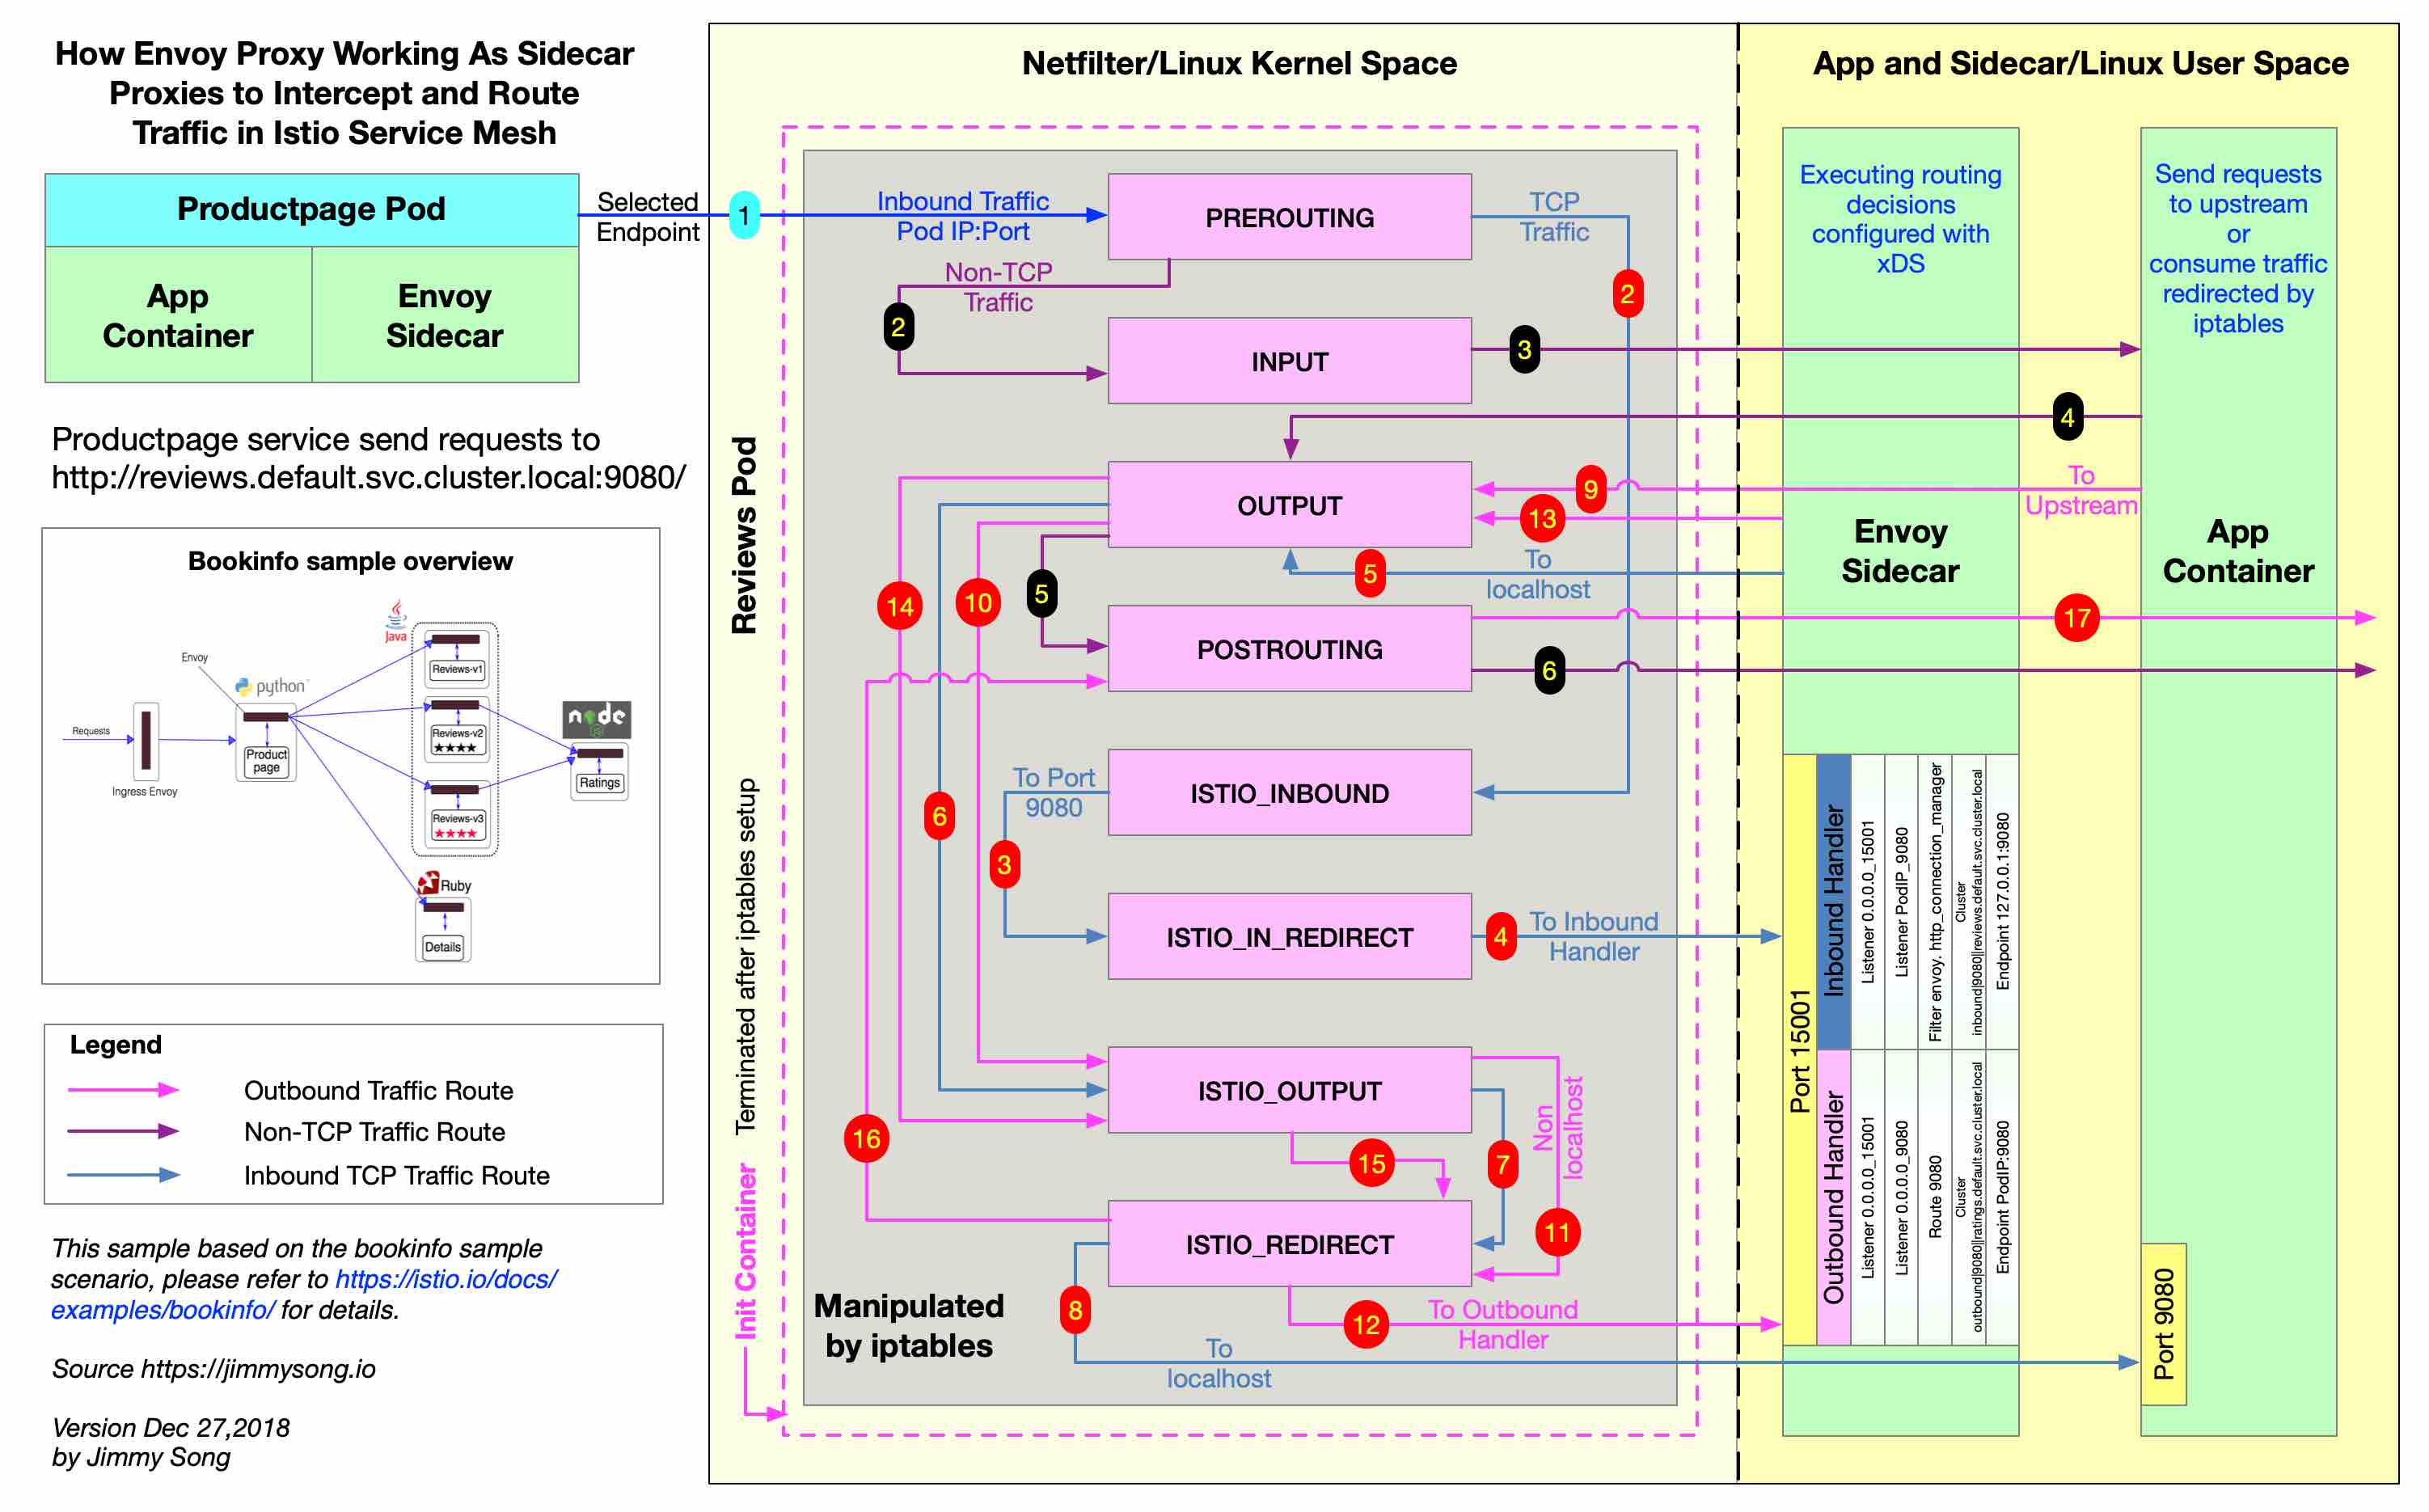
istio中流量的转发流程可以参考jimmy的这张图, 下面要说的是具体chain中的规则。
- inbound流量
1 | # iptables -t nat -nvL PREROUTING |
首先查看PREROUTING chain,可以看到,流量被送到ISTIO_INBOUND。
1 | # iptables -t nat -nvL ISTIO_INBOUND |
在ISTIO_INBOUND中,VM提供对外服务的端口3306和9080的流量被转发到 ISTIO_IN_REDIRECT。这里如果VM上面有新添加服务端口,需要修改了cluster.env之后重启istio服务。
1 | # iptables -t nat -nvL ISTIO_IN_REDIRECT |
在 ISTIO_IN_REDIRECT中,流量被送到了envoy处理。
- outbound流量
同理,这里只给出对应的链表规则:
1 | # iptables -t nat -nvL OUTPUT |
1 | # iptables -t nat -nvL ISTIO_OUTPUT |
这里的uid 1000其实就是envoy进程的uid,而0是root。之所以这样设置,是因为如果将root的流量都干掉了,将导致ssh无法连接主机。继续查看ISTIO_REDIRECT链的规则:
1 | # iptables -t nat -nvL ISTIO_REDIRECT |
这样就基本明白了inbound和outbound流量被送进envoy之前的转发过程了。